Build, Run & Scale · A Watchtower Series — Part 1 of 3
Compute spend on chip design keeps climbing faster than the designs themselves. Here’s where the money actually goes — and why your dashboards can’t see it.
It’s a conversation that repeats itself in fabless design orgs every quarter. The cloud bill for EDA workloads is up again. The design didn’t get 30% harder. Finance asks engineering to explain it; engineering points at the tools; the CAD team points at the regression queue. Everyone is partly right, and nobody can produce the number.
That’s the tell. When a cost grows and no single person can account for it, the problem isn’t the price — it’s visibility.
EDA compute doesn’t scale the way budgets assume
Most budgets model compute as if it tracks headcount, or gate count, in some smooth line. It doesn’t. EDA compute tracks verification cycles, regression sweeps, corner and timing runs, and — increasingly — the combinatorial explosion of multi-die and chiplet designs. Above all, it tracks burstiness. A team’s spend isn’t set by its average week. It’s set by its worst week, the one before tapeout when every engineer is launching jobs at once.
Plan against the average and you will be wrong twice a year, in the direction that hurts.
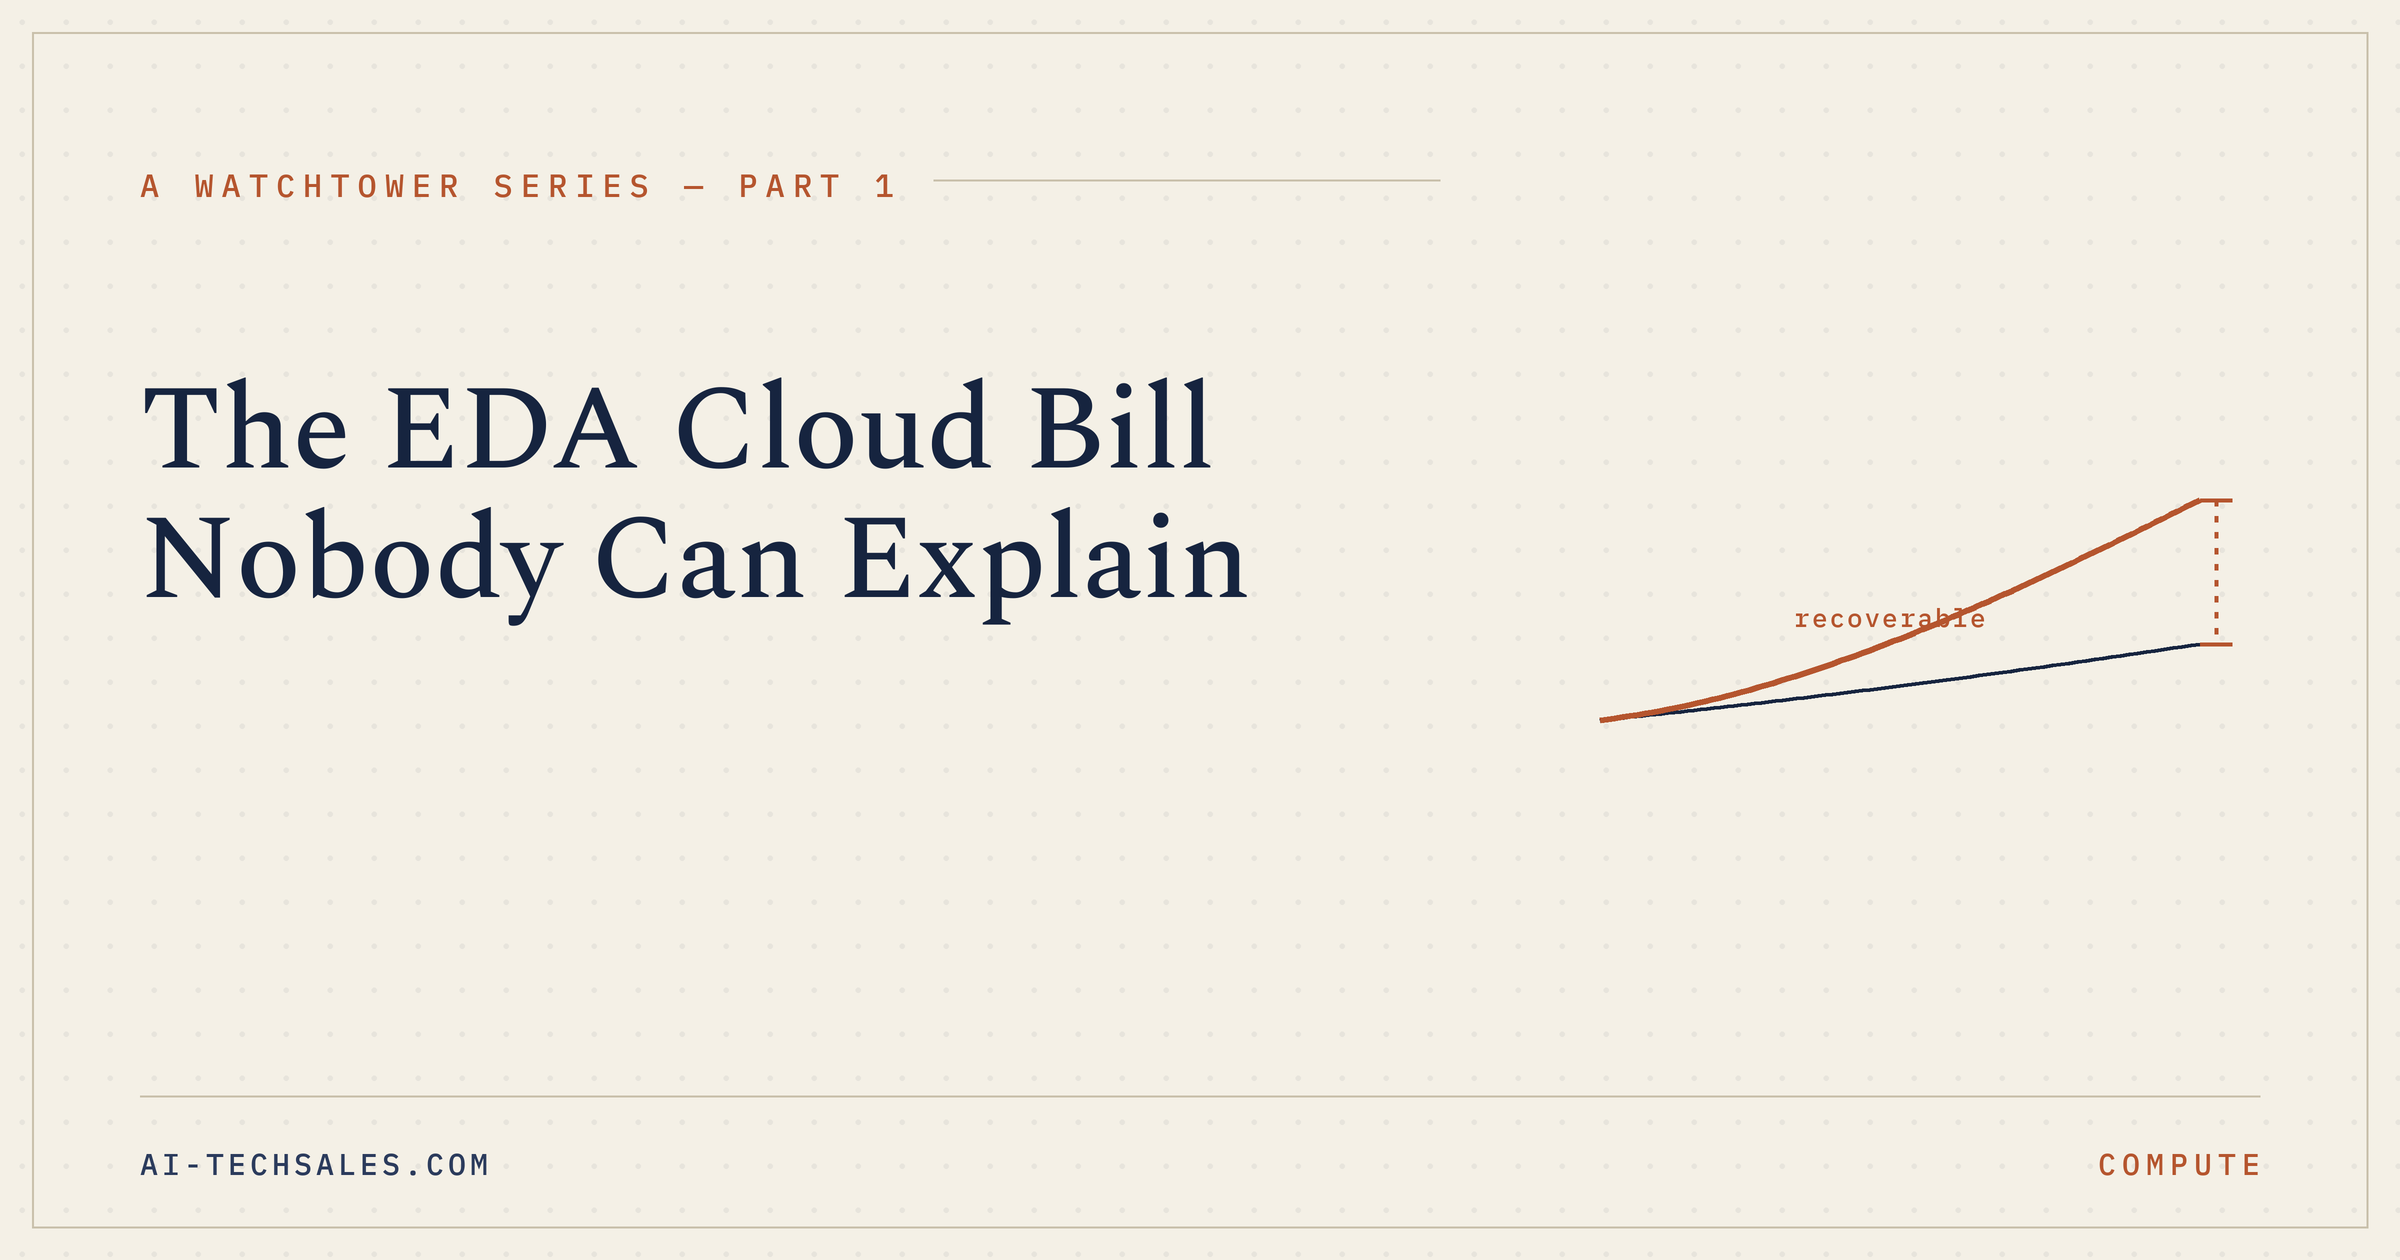
Fig. 1 — When the bill outpaces the design
Where the leakage actually hides
When teams finally instrument their EDA compute, the recoverable waste tends to live in the same handful of places:
Idle instances left powered on between regression batches — billed for hours of doing nothing.
Spot jobs that die uncheckpointed, get reclaimed mid-run, and restart from zero.
Oversized instance types chosen “to be safe,” never touching the headroom.
Reserved GPU capacity sitting idle while the team waits on something else.
Egress and storage nobody put in the model.
In organizations without active management, the recoverable slice is rarely small — commonly 20–40% of annual EDA cloud spend. On a real tapeout program, that’s a headcount.
Generic cost tools see instances. EDA teams need to see jobs.
Why your cost dashboard can’t find it
Most teams already pay for a cloud cost tool, and it still can’t explain the bill. Generic FinOps tooling sees instances, not jobs. It can tell you an instance ran 700 hours. It cannot tell you that 300 of those were idle gaps between batches, or that the job underneath could have run on spot — checkpointed — for a fraction of the cost. EDA waste is invisible to any tool that isn’t EDA-aware.
The same blind spot hides the upside. Flexible workloads can often run 60–90% cheaper on spot — but only if they’re checkpointed so a reclaim doesn’t cost you the run. And GPU pricing across the hyperscalers and the neo-cloud providers shifts constantly; the arbitrage is real, and impossible to capture by hand.
The reframe
This is not a FinOps problem you solve with a better spreadsheet, and not a procurement problem you solve by leaning on a vendor at renewal. It’s an observability problem at the job level. You cannot right-size what you cannot see in the terms your engineers actually work in.
The teams clawing back that 20–40% aren’t buying another dashboard. They’re putting an EDA-aware layer over the infrastructure they already run. That job-level visibility is the wedge Tuple Technologies built into the Stratos platform, and it’s where most infrastructure assessments begin: with the real number, on your own data.
The way in is never a demo — it’s a short assessment on one real program, using your own data